Provide donors with flexible options like covering processing fees, selecting impact areas and donation tiers, and receiving instant acknowledgments—all through mobile-friendly, easy-to-use donation forms.

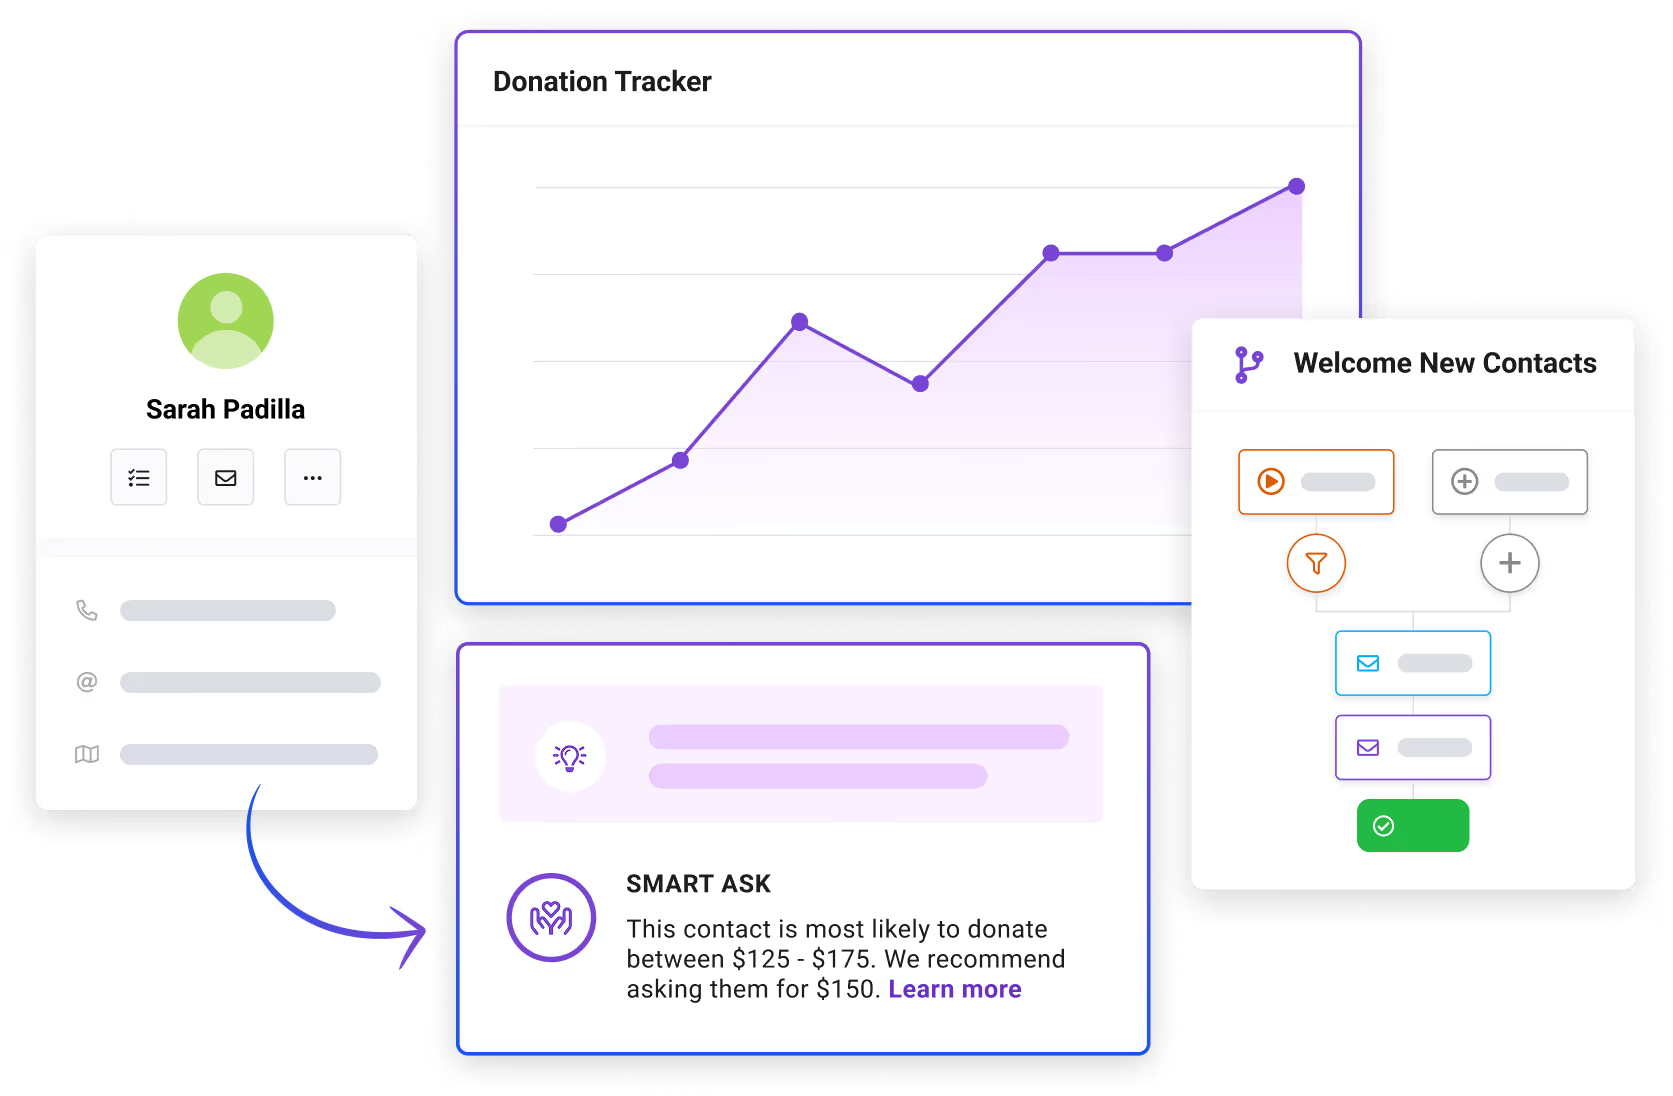
Leverage Keela’s AI to confidently predict ideal donation amounts and timing. These insights integrate smoothly with your existing workflows, optimizing donor engagement and enhancing your fundraising impact.

Accurately measure your progress through campaign thermometers and one-click reports that show you how effective your fundraising efforts are.

Save time by automating all gift acknowledgements and tax receipts so that you never have to worry if your donors feel appreciated.
.avif)
.svg)
Keela's fundraising insights show you when, how, and how much to ask from each of your donors in your fundraising system, so you’re never over or under asking again.

Use integrated communications tools to create personalized and automated fundraising appeals that have been proven to increase email open rates and inspire more donors to give.

Online giving is essential to achieving your fundraising goals. Keela provides secure payment processing solutions that ensure donors feel confident their gifts are protected.


Smart automation and personalized asks help you grow donations revenue without growing your team.
Automate time-consuming donor communication processes so you can invest energy to make the most impact
Real-time reporting and donor insights turn your data into actionable fundraising strategy.

“As a nonprofit, we are very happy we switched to this dynamic CRM. The software has made it easier for us to run multiple fundraising campaigns at once, and more importantly, it is easier for our donors to donate!”
“I've used most of the big players on the donor CRM market, and none offer the level of functionality, ease of use, or customer support that Keela does. Keela checks all of our boxes; no complaints here!”
“We love how easy it is for people to learn the system. New staff are up and running on it effortlessly. The customer service is also stellar. The team really listens to our needs and helps us find solutions.”
“Keela is a wonderful system and is extremely user-friendly. The data export and migration process was relatively straightforward and the platform is easy to use for those who are less tech-savvy.”
“[Keela] Changed the way our Nonprofit operates. I appreciate that I can collect volunteer and donor information, send eblasts, and collect and track fundraising.”
"Keela has achieved all the goals we had for a Donor/Contact Management System. Keela is easy to use, has most of the features we need, and the support team has been great.”
"We researched A LOT before purchasing and we're glad we did. The customer support is the best you can get. It is amazing. I also like that the various tools are well thought out and have a relatively easy user interface.”


Backpack Buddies needed support to reach their revenue goals. They used Keela’s nonprofit database software to grow their fundraising revenue and continue their mission.
Keela’s donation pages include a feature called Smart Ask. Smart Ask works behind the scenes of your donation pages to combine giving capacity, demographic data, and giving history and creates a custom suggested giving amount for every donor that lands on your donation page.
Yes! We understand that collecting both offline and online donations is important for fundraising success and Keela makes it easy to fundraise in the way that works best for your organization.
Keela was built BY fundraisers FOR fundraisers and has been designed to meet your unique needs. Our online fundraising software is designed to be user-friendly and work with you to help you reach your fundraising goals.