
KPIs for Nonprofits: Unlocking Success and Driving Impact [The Ultimate Guide]

As a nonprofit professional, you work hard to keep building and growing your nonprofit. But how can you measure your nonprofit’s growth over time? Or, more importantly, how do you use your nonprofit data to make progress faster?
What successful fundraising campaigns should you run again? How much should you ask your donors for? What social media platforms engage your prospects well enough? Where are your donations really coming from?
By identifying and tracking your nonprofit’s key performance indicators (KPIs), you can get answers to these questions and much more.
So how do you get started? What is a KPI, and how can you use them to grow your nonprofit? In this article, we’ll unpack everything you need to know to know about nonprofit KPIs.
Understanding Nonprofit Key Performance Indicators (KPIs)
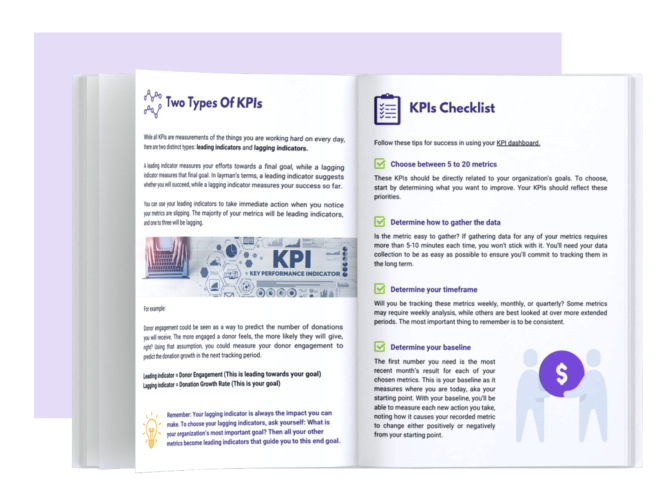
A Key Performance Indicator (KPI) is a metric that measures one particular aspect of your organization. It is used to assess the health and growth of your nonprofit organization over time.
There are 13 specific nonprofit KPIs that are considered standard reporting metrics, i.e., numbers and data you should always keep track of. These metrics are essential because they help you understand how well your organization is performing. You can use them to communicate your progress to your board members, co-workers, supporters, or other stakeholders.
Key Benefits of Using KPIs in Nonprofit Organizations:
1. Clear Measurement of Progress:
One of the primary benefits of using KPIs in nonprofit organizations is the ability to clearly measure your progress towards your mission. KPIs serve as tangible benchmarks that allow you to evaluate your performance against specific objectives and targets. By defining and tracking these metrics, you gain a deeper understanding of how well you're achieving your goals. Whether it's increasing the number of beneficiaries served, improving fundraising efficiency, or enhancing program outcomes, KPIs provide a clear yardstick to gauge your progress.
2. Enhanced Decision-Making
In the dynamic world of nonprofits, making informed decisions is crucial to ensure efficient resource allocation and optimal outcomes. KPIs play a vital role in this process by providing actionable data that informs your decision-making. With a clear understanding of your organization's performance, strengths, and areas for improvement, you can make strategic choices that align with your mission. For instance, if a KPI reveals a decline in volunteer engagement, you can focus on developing strategies to increase volunteer recruitment and retention, leading to improved program delivery.
3. Improved Accountability and Transparency
Nonprofit organizations often operate with the support of various stakeholders, including donors, board members, and the community at large. By utilizing KPIs, you enhance your organization's accountability and transparency. These metrics demonstrate your commitment to effectively managing resources and achieving measurable outcomes. Sharing KPIs with stakeholders fosters trust and confidence in your organization's ability to make a meaningful impact. Additionally, transparently reporting your KPIs can help attract new donors and supporters who are passionate about organizations that demonstrate clear performance metrics.
4. Efficient Resource Allocation
Effective resource allocation is a critical aspect of nonprofit management. KPIs provide valuable insights into the efficiency and effectiveness of your programs and initiatives, helping you optimize resource allocation. By analyzing KPIs related to fundraising costs, program expenses, and impact per dollar spent, you can identify areas where adjustments can be made to achieve greater efficiency. This allows you to allocate resources strategically, ensuring that your organization's efforts align with your mission while maximizing the impact you make within your community.
5. Continuous Improvement
Nonprofit organizations are constantly evolving and seeking ways to improve their operations and impact. KPIs play a vital role in driving continuous improvement by enabling you to identify areas for growth and innovation. By regularly monitoring and analyzing KPIs, you can spot trends, patterns, and potential bottlenecks that may hinder your progress. This empowers you to make proactive adjustments, implement new strategies, and experiment with innovative approaches that lead to enhanced outcomes and increased effectiveness.
The Process of Developing Nonprofit KPIs
Let's explore developing nonprofit KPIs and highlight key considerations for aligning them with your organization's mission and strategic objectives.
Step 1: Understand Your Nonprofit's Mission and Strategic Objectives
To begin the process, it is essential to have a clear understanding of your nonprofit's mission and strategic objectives. This includes determining the core purpose of your organization and the specific outcomes you aim to achieve. By aligning your KPIs with these guiding principles, you ensure that your measurements directly contribute to your nonprofit's overall goals.
Step 2: Identify Key Focus Areas
Next, identify the key focus areas that are critical for achieving your nonprofit's mission. These may include program effectiveness, fundraising, volunteer management, community impact, or any other areas that are central to your organization. By pinpointing these areas, you can narrow down your KPI selection to track and evaluate progress in each specific domain.
Step 3: Engage Stakeholders
Developing KPIs should be a collaborative effort involving various stakeholders within your nonprofit. Engage board members, staff, volunteers, and beneficiaries in the process to gather insights, perspectives, and expertise. This collective involvement not only fosters ownership and buy-in but also ensures that the chosen KPIs reflect the diverse needs and priorities of your organization.
Step 4: Define Measurable Outcomes
For each focus area, define specific, measurable outcomes that align with your nonprofit's goals. These outcomes should be both quantifiable and time-bound, allowing you to track progress and make informed decisions. Consider using the SMART framework (Specific, Measurable, Achievable, Relevant, Time-bound) to ensure that your KPIs are well-defined and actionable.
Step 5: Select Appropriate Metrics
With your measurable outcomes in place, it's time to select the most suitable metrics to track progress. These metrics should provide meaningful and relevant insights into your nonprofit's performance. For example, if your focus area is program effectiveness, metrics such as participant satisfaction, impact assessment, or cost per outcome achieved could be considered. Choose metrics that are aligned with your objectives and capable of measuring the desired outcomes effectively.
Step 6: Set Performance Targets
To further enhance the effectiveness of your KPIs, establish performance targets or benchmarks. These targets should be ambitious yet attainable, motivating your nonprofit to strive for continuous improvement. Consider historical data, industry standards, or best practices while setting these targets. Regularly evaluate and adjust them as needed to reflect changing circumstances or evolving goals.
Step 7: Establish Monitoring and Reporting Mechanisms
Develop a robust system for monitoring and reporting your KPIs. This may involve leveraging technology, implementing data collection methods, or establishing regular reporting cycles. Ensure that the necessary resources, tools, and processes are in place to track and analyze your KPIs effectively. Regularly communicate progress and insights to stakeholders, promoting transparency and accountability within your organization.
13 Essential Key Performance Indicators for Nonprofits
A strong case exists for nonprofits behaving a little more like for-profit businesses when it comes to learning to claim more of the pie. But nonprofits differ from many businesses because their primary mission is usually not to increase revenue. The irony is revenue is a critical factor in achieving your mission and furthering your impact, and as such, it’s worth measuring.
You could use hundreds of KPIs to measure any and every part of your organization, from fundraising metrics to email marketing metrics to event performance metrics. The world is your data-filled oyster.
However, having too many KPIs is just as dangerous as having no KPIs, so take some time to identify the KPIs that are best suited for your organization and track them consistently. I would recommend monitoring at least 5 KPIs and not more than 20.
Here are the most important nonprofit KPIs you should be tracking:
1. Donor Retention Rate
Donor retention rate is the percentage of donors who give to your organization one year and then give again the following year. It is a critical indicator of the effectiveness of your donor stewardship efforts and the loyalty of your donors. A high donor retention rate indicates that your organization is successful in maintaining relationships with donors, reducing donor attrition, and maximizing the lifetime value of each donor.
How to Calculate Donor Retention Rate
- Take the number of new donors you acquired last year: A
- Count how many of those donors (A) also gave this year: B
- Then divide this year’s number (B) by last year’s (A) and multiply by 100: (A/B) x 100
2. Donor Lifetime Value
Donor lifetime value refers to the estimated amount of revenue a single donor is likely to generate from the moment they first donate to the time they lapse. It helps nonprofits understand the long-term value of their donors and guides decision-making regarding resource allocation for donor acquisition and retention efforts. The higher the donor lifetime value, the more valuable each donor is to your organization.
How to Calculate Donor Lifetime Value
- Take the length of time a donor remains an active donor: A
- Multiply (A) by the average donation of that donor: B
- Now, multiply (B) by how often that donor donates.
3. Average Gift Size
Average gift size represents the average amount of donations received from individual donors. It provides insight into the giving patterns and preferences of your donor base. Monitoring changes in average gift size over time can help identify trends and evaluate the impact of fundraising strategies.
How to Calculate Average Gift Size
To calculate it manually, add up all of your “gifts” or donations and find the average for that period.
Average Gift Size = The sum of all gifts or donations divided by the number of gifts or donations received.
4. Donation Growth Rate
Donation growth rate measures the increase or decrease in donation revenue raised year over year. It helps nonprofits assess the effectiveness of their fundraising efforts and determine whether they are successfully expanding their donor base and generating more donations over time.
How to Calculate Donation Growth Rate
You will need to know the Average Gift Size (AGS) to calculate your donation growth.
Take the total amount of donations from this year and subtract your total donations from last year. Then divide your outcome by your total donation amount from last year. Now multiply what you can by 100.
To make it easier to calculate, use this equation:
[(2021 average gift size – 2020 average gift size) ÷ 2020 average gift size] x 100.
5. Recurring Gift Percentage
Recurring gift percentage represents the proportion of recurring gifts out of the total number of gifts received. It indicates the extent to which donors contribute on a recurring basis, providing stable and predictable revenue streams for the organization. A higher recurring gift percentage implies a stronger recurring giving program, which can enhance financial stability and sustainability.
How to Calculate Recurring Gift Percentage
Take the number of recurring gifts you receive monthly, divide it by your total number of gifts received, and multiply it by 100.
6. Fundraising ROI
Fundraising ROI (Return on Investment) measures the effectiveness and efficiency of fundraising campaigns. It compares the funds raised by a campaign to the total cost incurred, providing insights into the financial returns generated. A positive ROI indicates that the campaign generated more revenue than the invested resources, while a negative ROI suggests the need for adjustments in fundraising strategies.
How to Calculate Fundraising ROI
Use this equation: [(Funds raised by the campaign - Total cost of the campaign) ÷ Total Cost of Campaign] x 100
For example, if your campaign cost $10,000 and you raised $15,000, your ROI is: (15,000 - 10,000)/10,000 = 0.50
0.50 x 100 = 50%
7. Online Gift Percentage
Online gift percentage represents the proportion of total donations received through digital solicitation efforts, such as online fundraising platforms, email campaigns, or social media appeals. Tracking this KPI helps nonprofits assess the effectiveness of their online fundraising strategies and adapt their approach accordingly.
How to Calculate Online Gift Percentage
The total amount of online donations received ÷ the total amount of donations received x 100.
8. Email Open Rate
Email open rate measures the percentage of recipients who opened a given email. It reflects the effectiveness of your email marketing campaigns, audience engagement, and the relevance of your content. A higher email open rate indicates stronger audience interest and engagement.
How to Calculate Email Open Rate
Take the total number of fundraising emails opened and divide it by the total number of fundraising emails delivered, then multiply it by 100.
9. Email Click Rate
Email click rate measures the percentage of recipients who clicked on a link within an email out of those who opened it. It helps evaluate the effectiveness of your call-to-action and the level of engagement your audience has with your content. A higher email click rate indicates stronger reader engagement and interest in taking further actions.
How to Calculate Email Click Rate
Take the number of unique clicks in an email, divide it by the total number of emails delivered, and then multiply it by 100.
10. Social Media Engagement
Social media engagement involves measuring the rates at which your supporters amplify your message (shares, retweets), express support (likes, follows), and engage in conversations (comments, responses) on social media platforms. Tracking social media engagement metrics helps assess the effectiveness of your social media strategies and identify opportunities for growth and increased interaction with your audience.
Hootsuite outlined 19 social media engagement metrics that matter. Go over that article, and use the metrics listed to gauge your social media marketing efforts.

11. Donor Lifecycle Migration/Conversion
Donor lifecycle migration or conversion measures the movement of prospects or donors from one stage of the donor funnel to the next. It helps evaluate the effectiveness of your donor engagement and stewardship efforts in guiding donors toward higher levels of involvement and giving. Monitoring donor lifecycle migration assists in identifying areas for improvement in cultivating long-term relationships and converting engaged individuals into major gift donors.
How to Calculate Donor Lifecycle Migration/Conversion
To calculate this KPI, you simply calculate how many prospects or donors move from one stage of the funnel to the next in a period.
For example, if 45% of your donors became recurring donors last year, your donor lifecycle migration or conversion rate for this part of your funnel is 45%.
12. Donor Churn
Donor churn refers to the rate at which donors are lost or stop contributing to your organization within a given period. It is important to monitor donor churn to identify trends, assess donor attrition rates, and implement strategies to retain existing donors. A high donor churn rate may indicate weaknesses in donor engagement and stewardship efforts.
How to Calculate Donor Churn
Donor Churn is calculated by dividing the number of donors who contributed this year by the number of donors who contributed last year and multiplying that by 100.
13. Pledge Fulfilment Percentage
Pledge fulfillment percentage measures the proportion of donors who fulfill their promised donations out of the total number of pledges made. It helps assess the reliability of donor commitments and the effectiveness of pledge management. Tracking this KPI ensures accurate revenue forecasting and supports effective financial planning.
How to Calculate Pledge Fulfilment Percentage
Calculate the number of donors who keep their promises with this equation:
(Number of pledges fulfilled ÷ total number of pledges) x 100.
Leveraging Nonprofit KPIs for Strategic Decision-Making
Let’s delve deeper into the importance of leveraging nonprofit KPIs and into the process of interpreting and analyzing KPI data to drive meaningful actions.
Understanding the Significance of Nonprofit KPIs: Nonprofit organizations must identify and monitor relevant KPIs to gain insights into their performance, measure progress towards their goals, and make informed decisions. By selecting the right KPIs, nonprofits can align their actions with their strategic objectives and demonstrate accountability to stakeholders, including donors, beneficiaries, and the community at large. KPIs provide a clear picture of the organization’s impact, efficiency, financial health, and other key aspects crucial for sustainability.
Identifying Relevant KPIs: To begin with, nonprofits must identify KPIs that are directly aligned with their mission and strategic priorities. This involves a thoughtful selection process that considers the unique objectives and activities of the organization. Whether it’s tracking fundraising success, program effectiveness, volunteer engagement, or operational efficiency, KPIs should reflect the nonprofit’s core values and desired outcomes. By focusing on a concise set of KPIs, nonprofits can avoid data overload and ensure a more focused analysis.
Collecting and Analyzing KPI Data: Once the relevant KPIs have been identified, nonprofits need to establish effective systems for data collection and analysis. This may involve leveraging technology tools, such as constituent relationship management (CRM) systems or data analytics software, to streamline the process. Data should be collected consistently and accurately, ensuring its integrity and reliability. It’s crucial to define clear benchmarks or targets for each KPI to provide a basis for comparison and evaluation.
Interpreting KPI Data: Interpreting KPI data involves going beyond the numbers and uncovering insights that inform strategic decision-making. Nonprofits should look for trends, patterns, and correlations in the data to identify strengths, weaknesses, and areas for improvement. Comparing KPI performance over time or benchmarking against industry standards can provide context and help assess progress. Visualizations, such as graphs or charts, can aid in the interpretation process by presenting data in a more digestible and impactful format.
Driving Strategic Decision-Making: With a clear understanding of the KPI data, nonprofits can leverage it to drive strategic decision-making. The insights gained can guide resource allocation, program adjustments, fundraising strategies, and overall organizational planning. For example, if KPI data indicates declining donor retention rates, the nonprofit may decide to implement targeted stewardship programs or revise their fundraising approaches. By aligning decisions with the data-backed insights, nonprofits can optimize their impact and improve outcomes.
Best Practices for Using Nonprofit KPIs
Let’s explore the best practices for using nonprofit KPIs, including steps to implement them effectively, tips for aligning KPIs with organizational goals and mission, and strategies for engaging stakeholders to foster a KPI-driven culture within your nonprofit.
Steps to Effectively Implement and Utilize KPIs:
Define Clear and Measurable Goals: Start by identifying the key objectives and outcomes you want to achieve as a nonprofit. These goals should be specific, measurable, attainable, relevant, and time-bound (SMART). For example, if your organization focuses on education, a goal could be to increase the literacy rate in a specific community by 15% within the next year.
Identify Relevant KPIs: Once you have defined your goals, identify the KPIs that will help you track progress towards those goals. Consider both outcome-based and process-based KPIs. Outcome-based KPIs measure the ultimate impact of your work, while process-based KPIs track the effectiveness of the activities and strategies you implement to achieve those outcomes.
Set Benchmarks and Targets: Establish benchmarks and targets for each KPI to provide a clear measure of success. These benchmarks can be based on industry standards, past performance, or other relevant factors. Targets should be ambitious yet realistic, pushing your organization to strive for continuous improvement.
Establish Data Collection and Reporting Mechanisms: Implement a system to collect and analyze data related to your KPIs. Determine the frequency and format of reporting that works best for your organization. Leverage technology solutions to streamline data collection and reporting processes, ensuring accuracy and efficiency.
Tips for Aligning KPIs with Organizational Goals and Mission:
Involve Key Stakeholders: Engage board members, staff, volunteers, and beneficiaries in the process of defining and refining your KPIs. Their input and perspectives will help ensure that the selected KPIs align with your organization’s mission and reflect the values and priorities of your stakeholders.
Connect KPIs to Strategic Planning: Integrate KPIs into your strategic planning process. As you develop your strategic goals, consider how KPIs can measure progress and inform decision-making. This alignment will help you monitor whether your organization is on track and enable you to make data-driven adjustments as needed.
Foster Collaboration and Communication: Encourage open communication among team members and departments. Establish a culture where everyone understands the importance of KPIs and how they contribute to the overall success of the organization. Regularly share updates and progress reports to keep everyone informed and motivated.
Strategies for Engaging Stakeholders and Creating a KPI-Driven Culture:
Provide Training and Support: Offer training sessions and resources to help staff and volunteers understand the purpose and benefits of using KPIs. Ensure they have the skills and knowledge to collect and interpret data effectively. This investment in their development will contribute to a culture that values data-driven decision-making.
Recognize and Celebrate Successes: Celebrate milestones and achievements when KPI targets are met or exceeded. Recognize the efforts of individuals and teams who contribute to these successes. This positive reinforcement will motivate stakeholders and reinforce the importance of KPIs in driving organizational impact.
Continuously Review and Adapt: Regularly review your KPIs to ensure they remain relevant and aligned with your organization’s evolving goals and priorities. Seek feedback from stakeholders and make adjustments as needed. By embracing a culture of learning and adaptation, you can maximize the effectiveness of your KPIs over time.
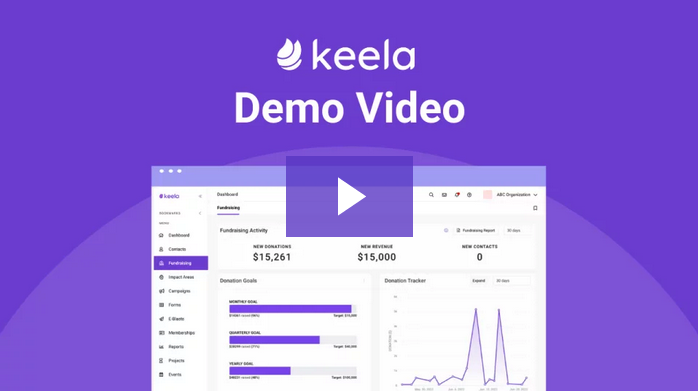
How to Track Nonprofit KPIs using Keela
Keela’s mission is to help nonprofit organizations create efficient strategies and have more impact. Our suite of intelligent reporting insights allows customers to have increased visibility into their organization’s financial health and have a detailed understanding of where they stand compared to similar organizations.
Using Keela, organizations can:
- Visually track their performance over time.
- Compare their progress and impact to similar organizations in terms of size and impact area.
- Download complete performance reports showing an analysis of their KPIs over time.
- Trigger actions based on real data.
If you’re using spreadsheets, that’s a great place to start for now. But if tracking and reporting your KPIs becomes too onerous for you, you should know that Keela CRM can easily display, track, and report your organization’s KPIs and benchmarks.
To learn more about how Keela can do all the KPI heavy lifting for you, speak with a Keela team member. Or, check out Keela’s Fundraising Report. It’s got everything you need to know in one report, generated automatically for your organization.
Report and Track KPIs with the Help of Keela!
Get a glimpse into Keela’s suite of nonprofit tools including performance tracking, reporting, KPI analysis, and more!
Overcoming Challenges in Implementing Nonprofit KPIs
Implementing Key Performance Indicators (KPIs) in a nonprofit organization is essential for effectively measuring and evaluating progress towards goals. However, it is not uncommon to face challenges during the process of integrating KPIs into your nonprofit’s operations. We will focus on addressing challenges related to data collection, measurement, and reporting, ensuring that your organization can successfully implement and leverage KPIs for improved performance
Data Collection Challenges
One of the primary obstacles in implementing nonprofit KPIs is acquiring the necessary data. Here are some common challenges you might face and ways to overcome them:
Insufficient data sources: Identify the key data sources required to track your nonprofit’s performance. Collaborate with internal stakeholders to ensure that all relevant data is being collected and establish systems or processes for capturing the required information.
Data quality and consistency: Maintain data integrity by establishing data quality controls and ensuring consistent data collection methods across different teams or departments. Regularly review and clean your data to eliminate errors or duplicates that may skew your KPI measurements.
Limited resources: Allocate sufficient resources, both in terms of personnel and technology, to support effective data collection. Consider leveraging technology solutions such as data management software or automation tools to streamline the process and reduce manual effort.
Measurement Challenges
Measuring progress accurately and meaningfully is crucial for KPI implementation. Here’s how you can address measurement challenges effectively:
Defining relevant KPIs: Begin by identifying and prioritizing the most critical metrics that align with your nonprofit’s goals and mission. Engage stakeholders in the process to ensure buy-in and relevance of the selected KPIs.
Aligning KPIs with strategic objectives: Ensure that each KPI is directly aligned with your nonprofit’s strategic objectives. This alignment fosters a clear connection between KPIs and organizational goals, making it easier to track progress and measure success.
Reporting Challenges
Effectively reporting KPIs allows your organization to communicate performance and facilitate decision-making. Overcome common reporting challenges with the following strategies:
Clear and concise reporting: Present your KPI data in a clear, concise, and easily digestible format. Use visualizations, charts, or dashboards to communicate key insights quickly and effectively.
Regular reporting cycles: Establish a regular reporting cycle to maintain consistency and enable timely decision-making. Consider setting up automated reporting systems to streamline the process and reduce manual effort.
Stakeholder engagement: Engage key stakeholders, including board members, staff, and donors, in the reporting process. Understand their information needs and tailor your reports to provide meaningful insights that align with their interests and priorities.
Ensuring Data Integrity and Ethics in Nonprofit KPIs
Importance of Data Accuracy, Security, and Privacy:
Reliable Decision-making: Accurate data is the foundation for informed decision-making. Nonprofit organizations heavily rely on data-driven insights to make strategic choices, allocate resources, and measure the effectiveness of their programs. Ensuring data accuracy helps in building trust in the decision-making process and ensures that the actions taken are based on reliable information.
Demonstrating Impact: Nonprofits aim to create a positive impact on the communities they serve. Accurate data is vital for effectively measuring and demonstrating this impact. By maintaining data integrity, nonprofits can provide evidence-backed results, making it easier to communicate their achievements to stakeholders, donors, and the public.
Grant Reporting and Compliance: Many nonprofit organizations rely on grants and funding to sustain their operations. Grantors often require detailed reports and evidence of outcomes achieved. Accurate data collection and storage are crucial to meet these reporting requirements and maintain compliance with grant terms.
Donor Trust and Transparency: Donors are increasingly conscious about how their contributions are utilized. Nonprofits need to ensure data security and privacy to build and maintain donor trust. By safeguarding sensitive data, organizations demonstrate their commitment to ethical practices and protect the privacy of those they serve.
Considerations for Ethical Data Practices:
Informed Consent and Data Transparency: Nonprofits must obtain informed consent from individuals before collecting their data. It is crucial to clearly communicate the purpose, scope, and potential risks associated with data collection. Organizations should also adopt transparent data practices, informing individuals how their data will be used and stored.
Anonymization and Privacy Protection: Nonprofit organizations should prioritize the anonymization of data whenever possible. By removing personal identifiers, organizations can minimize the risk of data breaches and protect the privacy of individuals involved. Implementing robust security measures, such as encryption and restricted access to data, further strengthens data protection.
Data Governance and Compliance: Establishing strong data governance frameworks ensures that nonprofit organizations adhere to legal and ethical guidelines while handling data. Developing clear policies and procedures for data collection, storage, and usage helps maintain compliance with relevant data protection regulations, such as the General Data Protection Regulation (GDPR).
Regular Data Audits and Quality Assurance: Conducting periodic data audits and implementing quality assurance processes are essential for maintaining data integrity. Nonprofits should regularly review their data collection methods, check for inconsistencies, and correct any inaccuracies promptly. By validating data quality, organizations can confidently rely on their KPIs to make informed decisions.
Conclusion
KPIs offer several benefits to nonprofits. They provide a clear measurement of progress towards organizational goals, enabling a deeper understanding of performance and the ability to evaluate effectiveness. KPIs also facilitate enhanced decision-making by providing actionable data and insights, allowing organizations to allocate resources strategically and improve outcomes.
Looking to the future, nonprofit KPIs will continue to play an evolving role. As technology advances, nonprofits can leverage tools and platforms that streamline data collection, analysis, and reporting. This will enable more organizations to effectively track and utilize KPIs for organizational success and increased social impact. By embracing a data-driven culture and prioritizing ethical data practices, nonprofits can unlock their full potential and drive positive change in their communities.